While the Maneuvering and Reporting tools have not been researched, tested, and designed to the same depth as the Orbit Determination Tool, they have been considered throughout the research and design process from the broader perspective of the application.
The FDS system supports missions that require communication between satellites and ground systems in order to estimate the position of a satellite, as well as perform any maneuvers to keep the satellite in a nominal position. Some key features of FDS include Orbit Determinations (OD), generating products (Ephemerides, TLE’s, reports, etc.), and Maneuvering, such as station keeping, conjunction assessment, and COLA’s (burns). (pdf)
- FD Design Specifications (pdf)
- FD Wireframes (pdf)
- FD Sample App (live deployment)
- FD Sample App Source Code (Github Repository)
Orbit Determination:
- Select, create, edit scenarios for commonly performed orbit determinations
- Select, edit and filter track data from ground stations
- Simulate propagation of orbit to gauge OD quality
- Generate necessary reports and products
Maneuvering:
- Simulate station keeping, attitude control, conjunction assessments, and COLA’s to evaluate maneuver plans
- Generate necessary reports and products
Reporting:
- Generate, compare, and manage orbital analysis and maneuvering reports and products
UX Research Findings
Inefficient and redundant tasks frustrate OA’s
An efficient FDS application should automate redundant tasks for the operator, as well as create a unified experience across the enterprise, reducing the training time it takes for OA’s to learn the system and begin contributing meaningful work right away.
UX research conducted in collaboration with users and domain experts on existing FDS workflows and systems identified the following:
Redundancy:
One of the biggest hurdles for OA’s was the inefficient repetitiveness in which their tasks are performed.
Pain Points:
- Navigating through system folders was laborious, as the system did not recall and retrieve the appropriate folder path logic.
- Hours were spent manually transferring data from a primary system to secondary workstations. This results in running the risk of data relics being improperly stored or lost.
- For every new satellite OD, it was required to close and reopen the software. This process added time to their daily workload.
FDS Design Solution: Implementing smarter logic into the system to allow the OA to retrieve data in more efficient ways.
There is not a current, unified FDS solutions
UX Research also revealed that each mission used their own, sometimes unique set of tools to perform similar tasks. Some of these findings include:
Dispersed software:
While some operations use older legacy systems to perform tasks like OASYS, other operations use off the shelf 3rd party commercial software (AGI STK, ODTK) – and others may build their own systems to meet their needs (OCEAN, TRAPEZE). Each user had strong opinions in favor or against their missions FDS software.
Pain Points:
- The OASYS legacy system did not provide the 2D/3D visualization that is often times helpful for visual minded operators, or when explaining solutions to leadership.
- Programs like FreeFlyer came with too many options with a small margin of error, resulting in user input errors.
- Key information is often times not accessible in the operators current software solution which costs time when tracking and identifying necessary data from outside sources.
Operator training and retention:
- The training and onboarding time to learn these softwares can be very involved.
- Just because an OA is trained, does not mean they are proficient. Often times OA’s are reassigned after just a few months and never fully get immersed enough to be able to contribute to the mission. This is why most advanced OA’s often times are contractors.
- Some OA’s are hybrid TT&C operators, they may bounce through many different applications to perform tasks, each one with a different user experience and interface.
FDS Design Solution:
- Using best practice UX Design . Leveraging the ASTRO UX Design System allow operators from different missions to learn one set of user interface components. This helps onboard and train new OA’s to begin contributing to the mission immediately, as well as transitioning existing OA’s by allowing them to focus more on their mission and less on learning a new system.
- Tabular Data and Visual Data . While some users interviewed were more ‘data people,’ there was a strong desire to visualize the orbit through a 2d/3d simulation, as some operators understand and digest visual information more effectively. We identified areas of the application where this data existed and integrated more system flexibility by allowing an OA to switch views between tabular data and visual data.
- 3rd party solutions . Inspiration was drawn from the off-the-shelf products created for Flight Dynamics such as FreeFlyer and ODTK. We wanted to leverage the thinking behind these softwares that our users were partial to, while adhering to the unique capabilities of the FDS legacy software, OASYS. The FDS designs include customizable “Scenarios” that allow OA’s to create or pre-load any orbit determination type as well as generate any necessary products or reports with minimal effort.
- Creating Utility Tool Kits . Identify and abstract the key common features shared between the dispersed tool sets. This lead to the creation of Utility Tool Kits. Utility Tool Kits are temporary work environments for key subtasks such as filtering track data or propagating a satellite. User testing revealed that different missions do these in different order. By leaving the subtasks open and agnostic to the mission, users can approach orbit determinations in each of their unique ways.
UX Design
Based on this initial research and follow-up design iterations with operators and stakeholders, the resulting design effort focused on a common, streamlined design, reducing the redundancy in user tasks required to support key functionality and task flows, while remaining agnostic enough to support unique mission needs. The app is designed to occupy its own browser window, allowing operators to focus on the task at hand, while possessing Utility Tool Kits that allow operators to access secondary workflows without using up the screens default real estate. The FDS app is set up to support single or multi-monitor work station configurations.
Framework
Based on system requirements and user research, the architecture of the application provides the guidance needed to build an FDS app, yet remains agnostic to the mission needs.
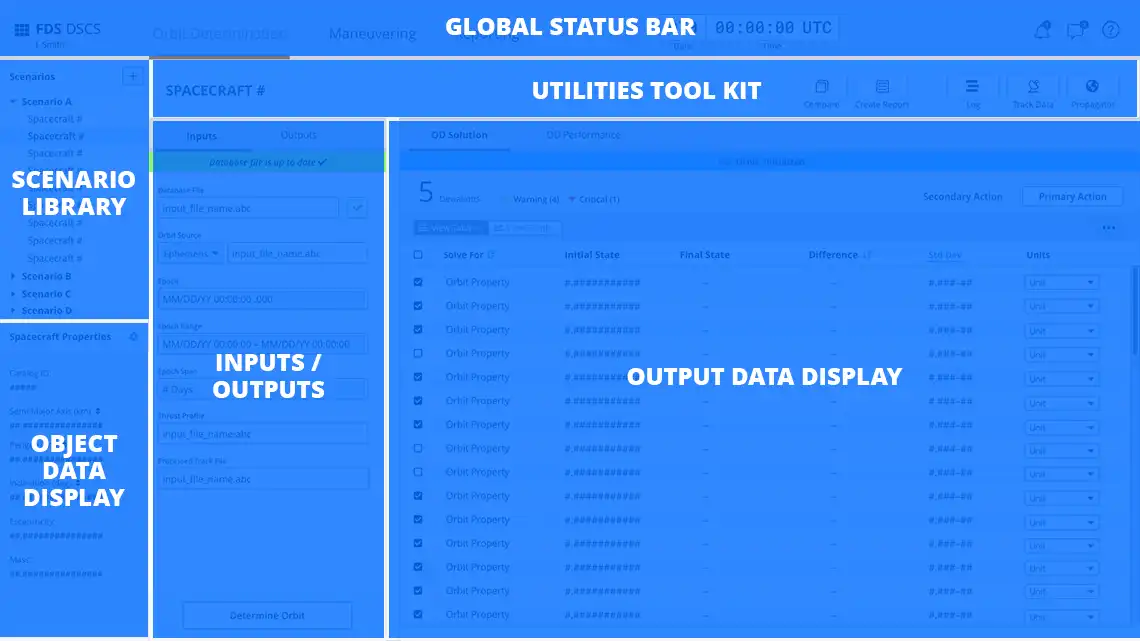
FDS Orbit Determination
For operators of the FDS Application, flexibility and automating redundant tasks are key. The FDS App supports missions and their unique work flows, as well as the customization of common scenarios, allowing OA’s to load and store attributes that are unique to each satellite, without having to reinvent the wheel each time.
Global Status Bar
The Global Status Bar of the FDS App contains a single sign in, high level navigation tabs to switch between tools, a clock and notification, chat and help icons. Monitoring icons may be included if the mission requires additional situational awareness.

- App Switcher Menu - The App Switcher Menu allows the operator to launch new instances of different apps, sign in/sign out, and edit preferences. The App Name appears directly to the right of the menu.
- Navigation Tabs - The navigation tabs allow the operator to switch between workspaces or tools.
- Global Clock - The global Clock is central to FDS service task flows, so it is included in the Global Status Bar.
- Monitoring Icons * - The monitoring icons communicate status to an operator. Each icon displays a color associated with the status level and a badge to indicate the number of alerts.
- Notification *, Chat and Help Icons - notification, chat and help icons display system messages, while chat handles the human-to-human messaging
* Functionality for these components is pending user testing
Scenarios
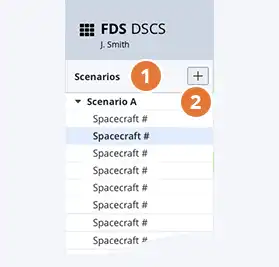
The scenarios panel is where a task begins. Depending on common mission tasks, operators may create, edit, or delete scenarios that best fit their workflows. For example, if an operator performs orbit determinations on Mondays for each satellite they are responsible for, they might create a “Nominal OD” scenario. Clicking a satellite in this scenario would load its last state, its last input files, and pre-select all the necessary products and reports needed for this task.
- Expandable/Collapsible Scenario Groups - Expands to show items, such as spacecrafts, grouped in the respected scenario for quickly loading the attributes for the scenario.
- Create New Scenario - Allows operators to create and name new scenarios.
Properties Pane
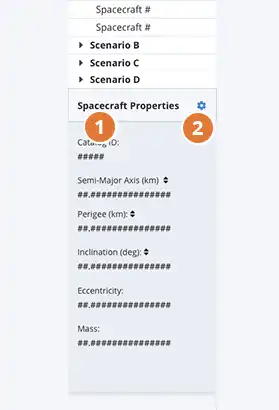
The properties pane displays various attributes an operator may expect to see when selecting an item in the scenarios panel.
- Properties - Displays select items attributes and/or properties.
- Properties Settings - Users can edit what properties they wish to display in the properties pane, using the properties settings feature.
Inputs/Outputs Pane
Inputs
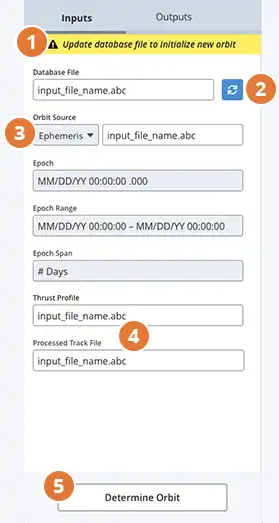
The inputs pane houses the initial input files required in order to run an orbit determination.
- Notification Banner - Indicates whether the latest database file has been synced.
- Sync Button - The sync button allows an operator to quickly load the latest database file into the database and initialize the orbit for a new orbit determination.
- Orbit Source - The orbit source field displays what source is being used to determine the orbit (TLE, Ephemeris, etc.). Source type can be selected from the Select Menu.
- Epoch Fields - Displays the reference epoch, range, and span for the selected input file.
- Other inputs - Missions may require different input files to determine their orbit. The remaining fields provide this flexibility. For instance, some user permissions may allow for replacing, or not including a Thrust Profile for maneuvers, or a Processed Track File in determining an orbit.
- Determine Orbit Button - The determine orbit button initializes an orbit determination.
Outputs
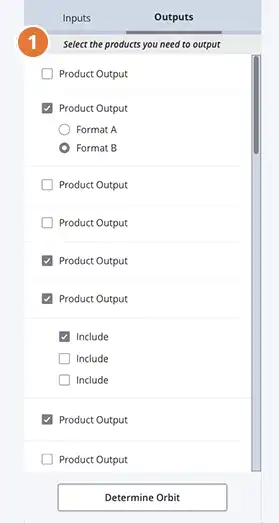
The outputs pane houses the required output files and products for a scenario.
- Products and reports are pre-selected based on the scenario selected, but an operator may include or exclude any before running an orbit determination.
Data Display
The data display is a multi-functional output view of an orbit determination.
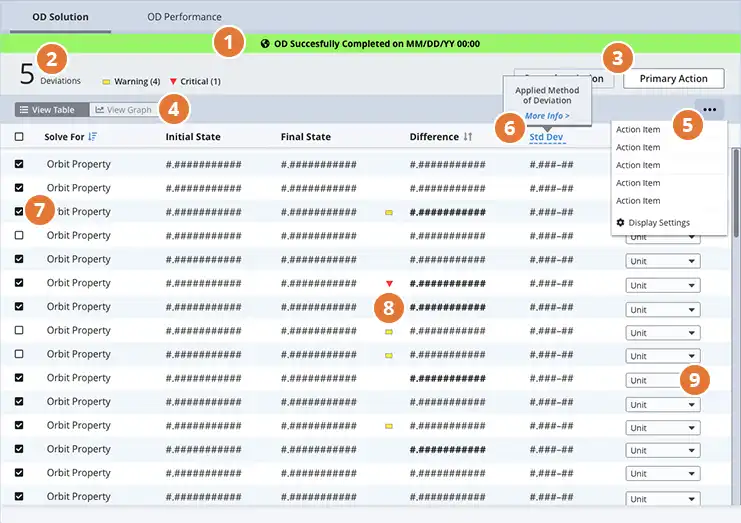
- Notification Banner - The Notification Banner shows the status for the latest/last orbit determination that was initiated.
- Deviation Count - The deviation count shows the total number of deviations (violations of the standard deviation found in the OD Results.
- Primary/Secondary Action Buttons - Action buttons to be defined by mission. These could include actions such as “Create TLE, etc …”.
- Table Segmented Button - The table Segmented Button allows an operator to switch from viewing data in a tabular format to a visual data display.
- Action Menu - The action menu is reserved for non-primary actions an operator would execute such as export table, print, save, or table display settings.
- Interactive Text Affordance - Allows the operator to click for additional information about the method of standard deviation being applied to the column.
- Selectable Table Rows - When setting up an orbit determination an operator can select to include or exclude the orbit properties they wish to solve for. These properties should be pre-selected based on the scenario applied.
- Status Icons - Indicates the severity of the standard deviation violation.
- Editable Table Data (Select Menu) - Allows the operator to view table data in different units of measurements.
Utility Tool Kit
The Utility Tool Kit is a collection of contextual utilities for accessing secondary task flows. These remain agnostic to the needs of the mission. Launching a utility opens up a new window at any default size the mission deems useful. Utility windows behave like browser windows and have the ability to be resized, expanded to full screen or minimized.

- Compare - Allows operators to compare reports or products.
- Create Report - Allows operators to create reports that are contextual to the satellite and scenario.
- Log - Displays a log of application and system messages, including errors, informational messages and warnings.
- Track Data - Allows operators to select, edit, and filter raw tracking data and create processed track files.
- Propagator - Allows operators to create and visualize ephemerides and TLE’s.
Log Utility
The Log Utility shows a log of application and system messages. Usage and functionality of this utility is mission-agnostic based on what is most valuable to the operator/mission.
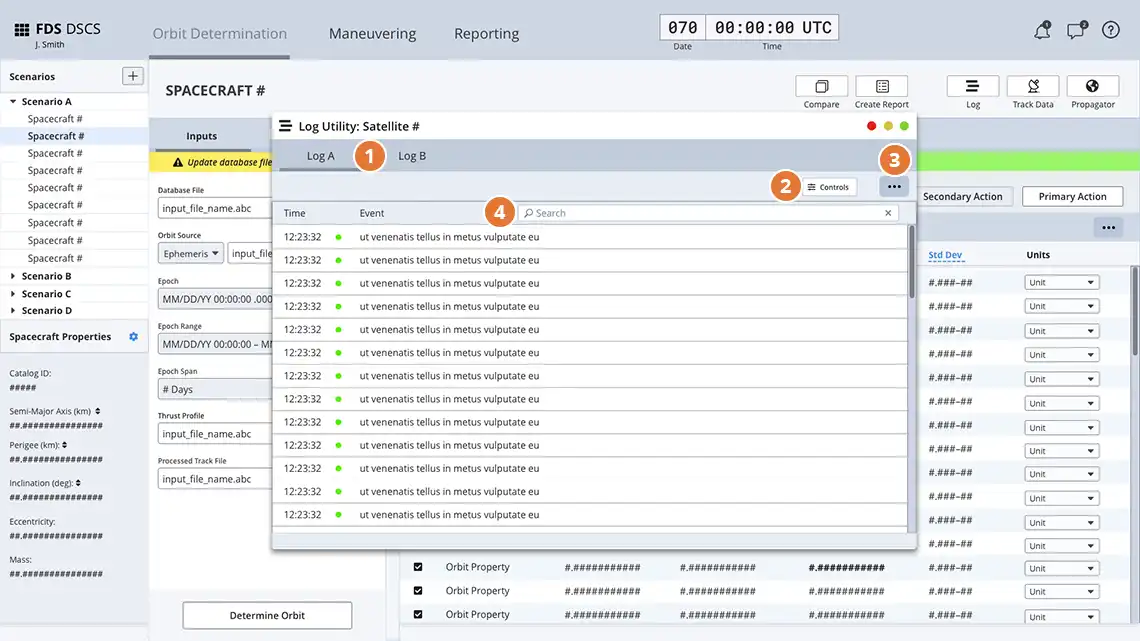
- Tabs - Allows for more than view or category of log messages.
- Control Buttons - Triggers a slide in pane that allows the operator control over the event log display.
- Action Menu - The action menu is reserved for non-primary actions an operator would execute such as export, print, save, etc…
- Search Bar - Allows an operator to query log messages based on type string match.
Track Data Utility
The Track Data Utility is an identified secondary task flow an operator would execute in order to select and filter raw tracking data to get the best results for an orbit determination.
Track Data Utility: Select Raw Tracking Files
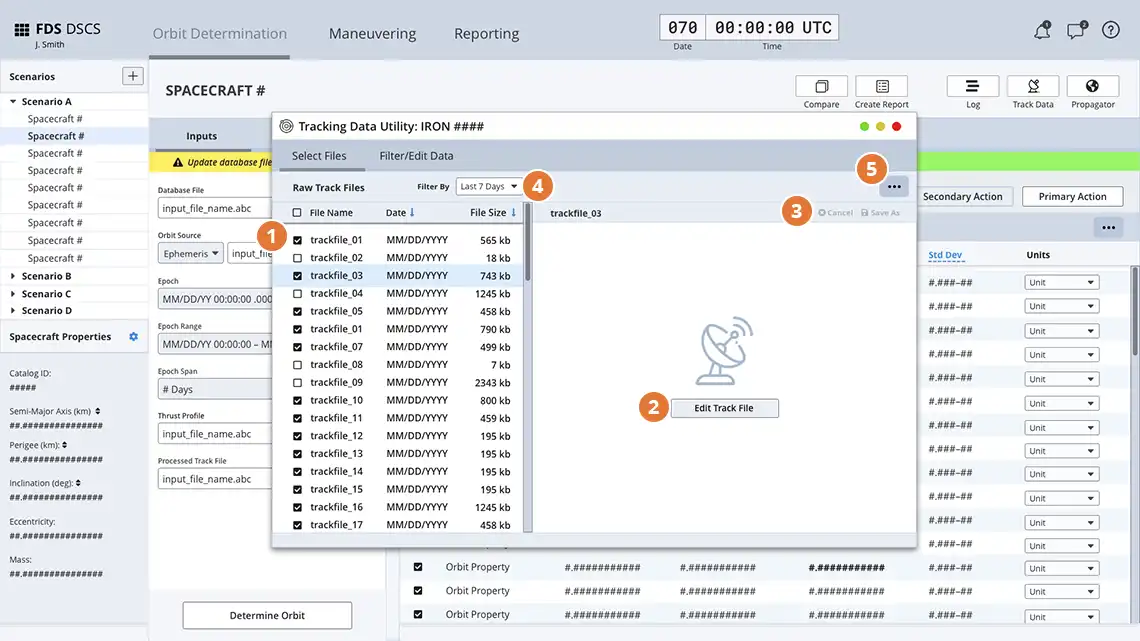
- File List - Displays a table list of raw tracking data.
- Edit Track File Button - Allows operator to edit/remove data from a track file.
- Text Editor - Allows operator to edit and save/save as data from a track file.
- Filter Dropdown - Allows operator to filter track data display by time frame.
- Action Menu - The action menu is reserved for non-primary actions an operator would execute such as export, print, save, etc…
Track Data Utility: Filter Data
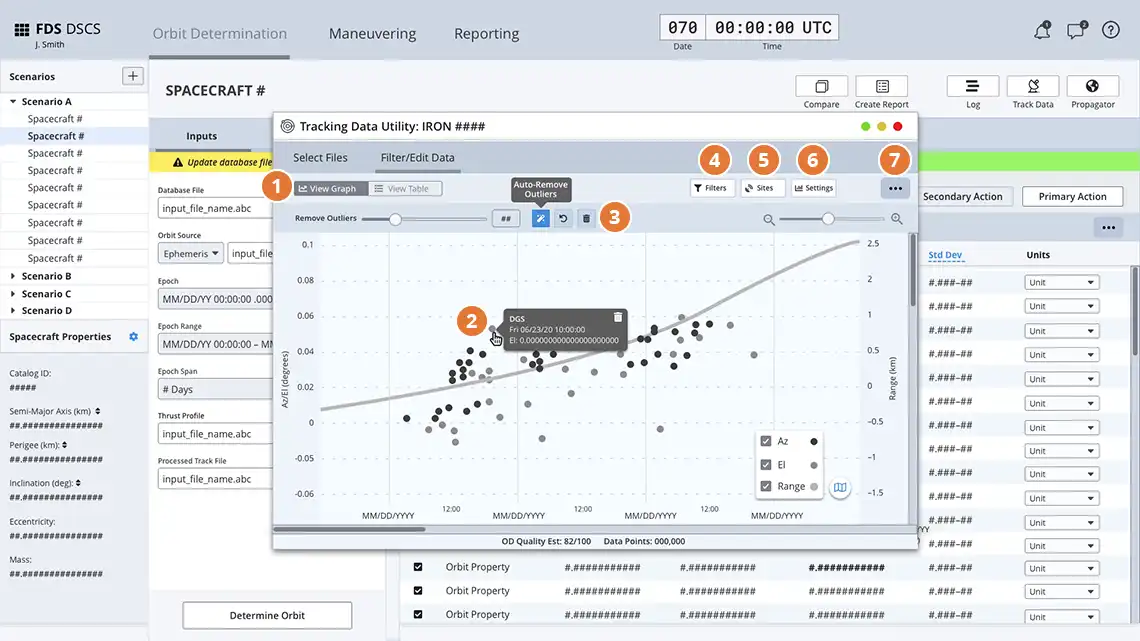
- Data Display Segmented Button - Allows operator to change views from tabular data to a visual data display to view individual track data points.
- Track Data Contextual Information - Clicking on an individual plot data instance will show additional information or actions associated with the track data. An example would be what ground station the track data point is from as well as the date/time of the impression and it’s elevation numerical data.
- Remove Outliers Controls - Lets operators manually delete outlying data points by clicking and deleting, or drag a threshold slider to get a desired result. Clicking the auto-remove button will let the system remove outliers based on a pre-defined algorithm set by developers.
- Filter Button - Slide in panel that displays track data filters. Filters can be included or excluded by checking them off or on, as well as entering manual data into the filter for more refinement.
- Settings Button - Displays generic settings for the display of data.
- Sites Button - Slide in pane that displays tracking sites. Tracking sites can be displayed or hidden by checking them on or off. Clicking the settings cog on a tracking site allows operators to enter in site biases to include in the orbit determination.
- Action Menu - The action menu is reserved for non-primary actions an operator would execute such as export, print, save, etc.
Propagator Utility
The Propagator Utility is an identified secondary task flow an operator would execute in order to create an Ephemeris or TLE file.
Input Source
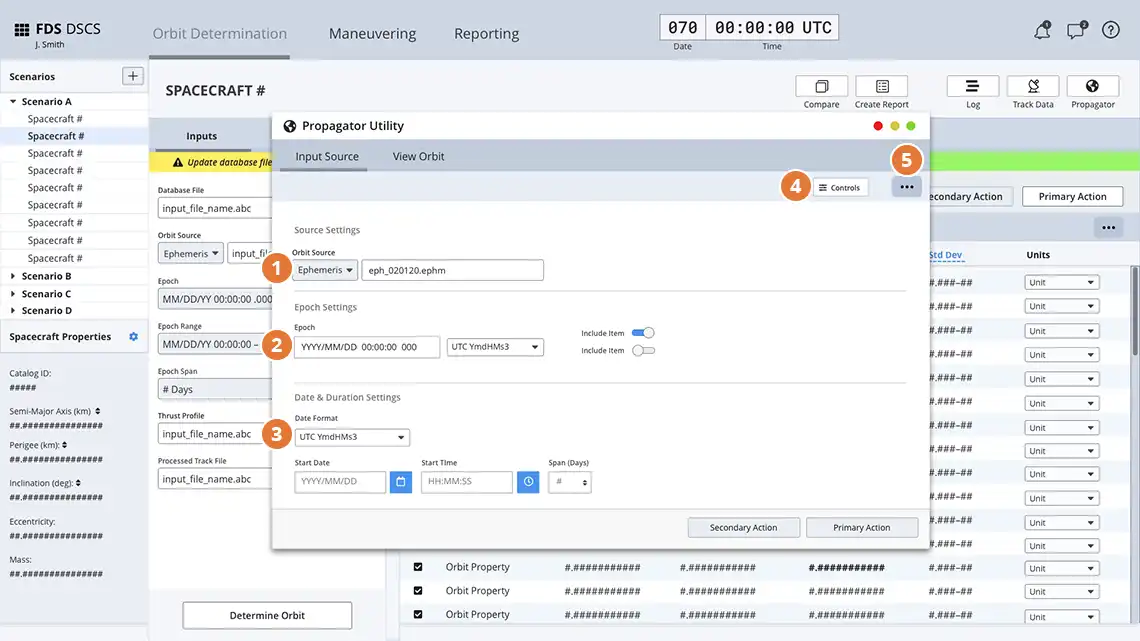
- Source Settings - Allows an operator to select an orbit source and an input file for generating the ephemeris or TLE file.
- Epoch Settings - Allows operator to set an epoch in the orbit source.
- Date and Duration Settings - Allows operator to set the span length of the orbit source.
- Controls Button - Slide in pane that allows operator to interact or edit the propagation controls. These should be pre-selected and set based on the satellite and scenario.
- Action Menu - The action menu is reserved for non-primary actions an operator would execute such as export, print, save, etc…
View Orbit
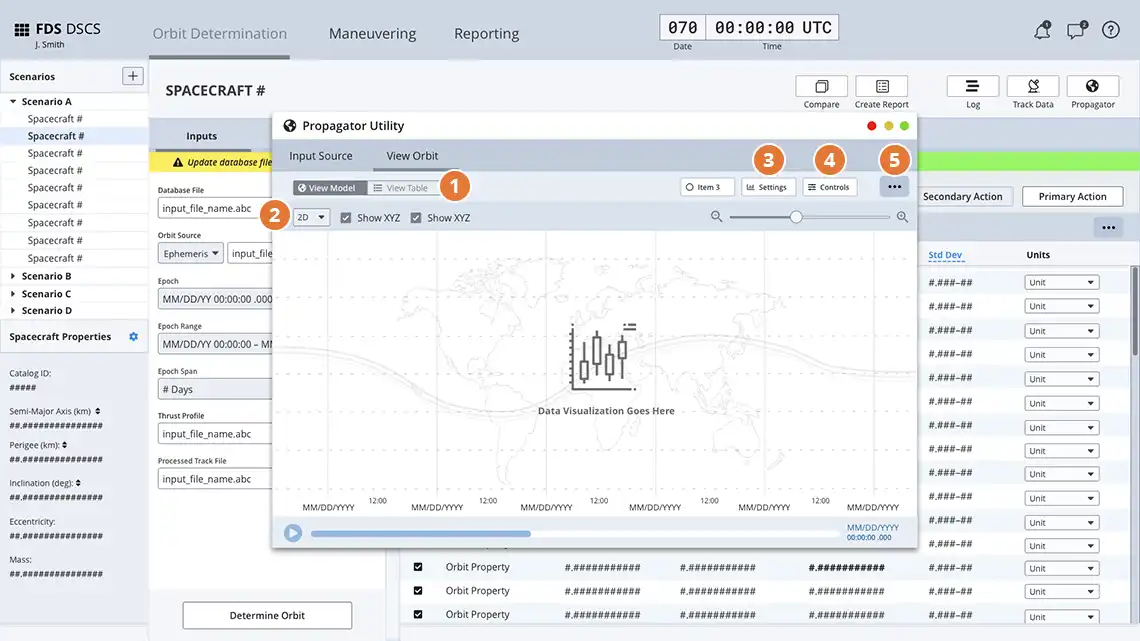
- Orbit Visualization Segmented Button - Allows an operator to switch between a tabular data view and a orbit visualization with the applied orbit source and settings.
- Orbit Data Display - Displays in 2D/3D the orbit track with the applied orbit source and settings as well as a play button to run the simulation.
- View Settings - Allows operator to edit the display view of the data display and table data
- Controls Button - Displays general settings.
- Action Menu - The action menu is reserved for non-primary actions an operator would execute such as export, print, save, etc…